

Food for Thought #8
Food for Thought #8
Tightening Condition, New earnings review, What charts are telling us?

I have exciting news to share: You can now read Giro’s Newsletter in the new Substack app for iPhone.
With the app, you’ll have a dedicated Inbox for my Substack and any others you subscribe to. New posts will never get lost in your email filters, or stuck in spam. Longer posts will never cut-off by your email app. Comments and rich media will all work seamlessly. Overall, it’s a big upgrade to the reading experience.
The Substack app is currently available for iOS. If you don’t have an Apple device, you can join the Android waitlist here.
Disclosure: All posts on Giro’s Newsletter are for informational purposes only. This post is NOT a recommendation to buy or sell securities discussed. So please, do your work before investing/gambling your money.
(12 minutes read)
Today’s outline
Latest Posts ($NU, PIX)
Tightening Condition
Calibrating estimates
What charts are telling us?
In case you missed it ($PBR, Oil, GDP)
Closed Ideas
Latest Posts
Tightening Condition
In the past couple of weeks, the sell-side started reviewing its expectations, which is a challenge amid the uncertainty of war and disruptive geopolitics.
The consensus is that commodities are the primary channel for inflation and growth — though we cannot discard the odd of a shock related to recent events, such as the US banning oil import from Russia and the European Commission proposing a sharp cutback on gas import.
However, I don’t think the EU could reach energy independence any time soon. Much has been said about acceleration on the run for alternative energy sources. I partially agree.
One of the primary components in renewable energy is scarce and expensive base metals, such as Nickel. Therefore, I would not expect any short-term changes.
In my opinion, the consensus baseline for Brent and European natural gas are still behind the curve, in US$100-110/bbl and €100-120/MHw.
Higher energy prices and upward pressure on foods prices (wheat, corn, and so on) should generate a material impact on inflation, kicking the annualized inflation for 1H22 for a multi-decade high (>7%).
Although the threat to global growth comes from a drop-off in consumption, weakening job growth, and tightening financial conditions, sentiment in the US still booming given the excess savings cushions (wealth is up almost 15% vs. pre-pandemic). Nevertheless, the US growth will eventually suffer from conditions that keep deteriorating.
Also, the economic consequences of the invasion of Ukraine are spread wide. Still, a major theme driving EM assets recently is weaker growth and higher inflation, or stagflation.
There is a fairly consistent historical pattern of commodity producers’ countries outperforming large commodity importing countries’ markets in Asia.
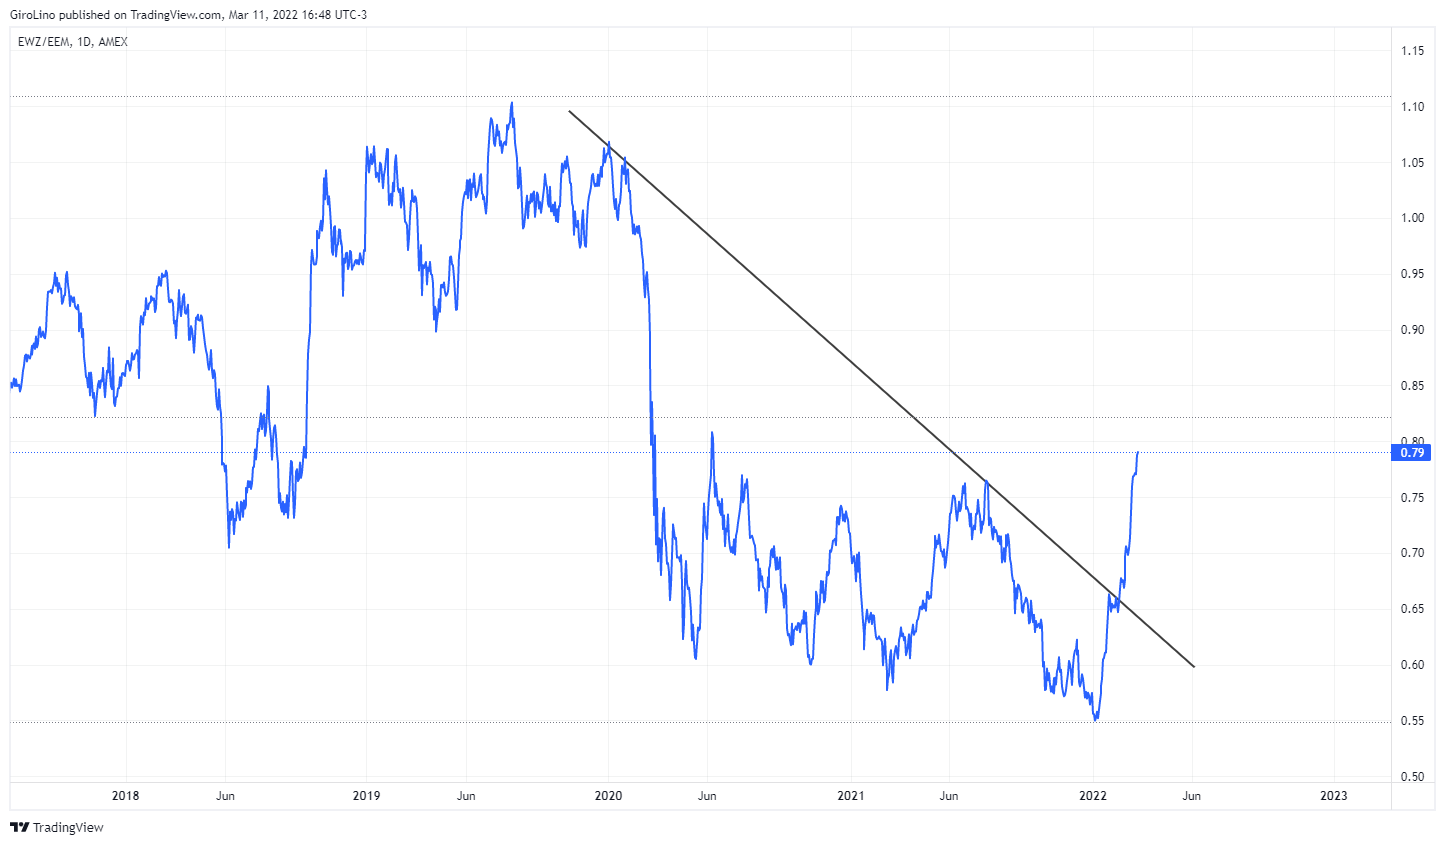
Brazil and other commodities producers offer tactical protection against the concerning mix of weaker growth and higher inflation impulses across EM equities.
We recently enjoyed a nice outperformance from a trade long EWZ and short EEM (see Closed Ideas). The EM Index is a composition of 60% Asia, 12% India (fiscal is deteriorating fast), and 28% RoW (rest of the world).
Nevertheless, stagflationary periods are rare in recent history, and the conditions surrounding episodes of weaker growth with higher inflation have been reasonably differentiated from period to period.
For instance, Brazilian equities underperformed the market during late-cycle slowdowns (‘07/’15), resulting in more significant drawdowns.
It seems the trade works better during mid-cycle slowdowns (‘02/’04/’10/’19), where commodities prices perform well while the risk premium sustains the outperformance.
I recently left the trades (long EWZ, short EEM/SPY) because it’s hard to identify if this is just a mid-cycle movement or a late one.
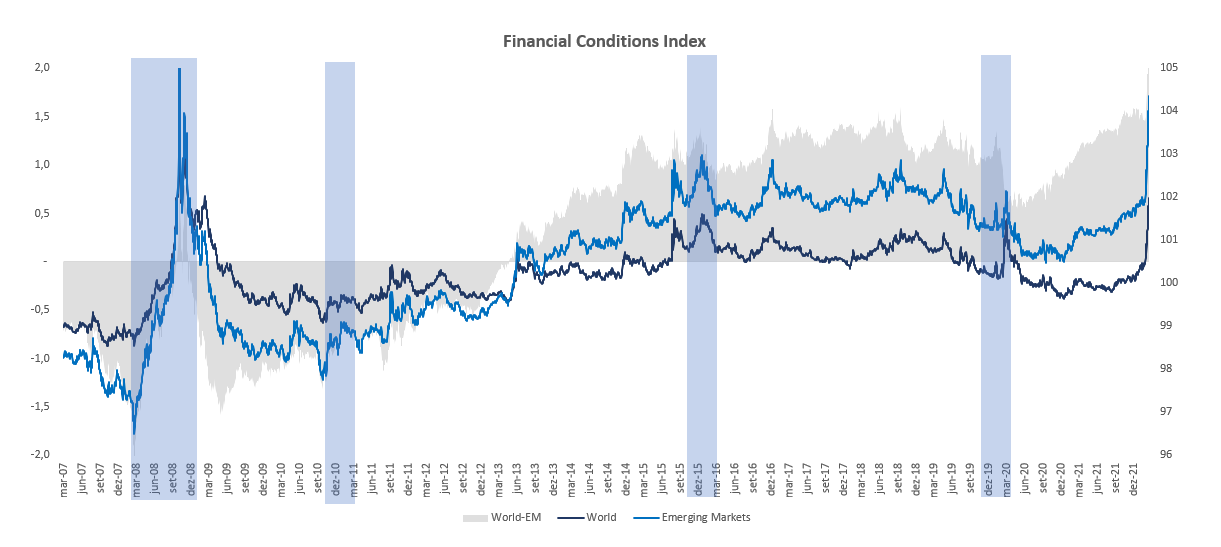
Historically, more abrupt changes in financial conditions (“FCI”) usually come with an exogenous shock (such as a war) and indicate a late-cycle movement.
“FCI is defined as a weighted average of riskless interest rates, the exchange rate, equity valuations, and credit spreads, with weights that correspond to the direct impact of each variable on GDP” (GS).
Also, all the commodities producers (such as Brazil and South Africa) are trading in resistance regions, with is a second signal that pulls me out of the trade.
Calibrating estimates
The Bank of America (“BofA”) published a report (which I did not have access to) with the image below, which suggests that the bank is bull with value plays and assets that benefit from geo conflicts.
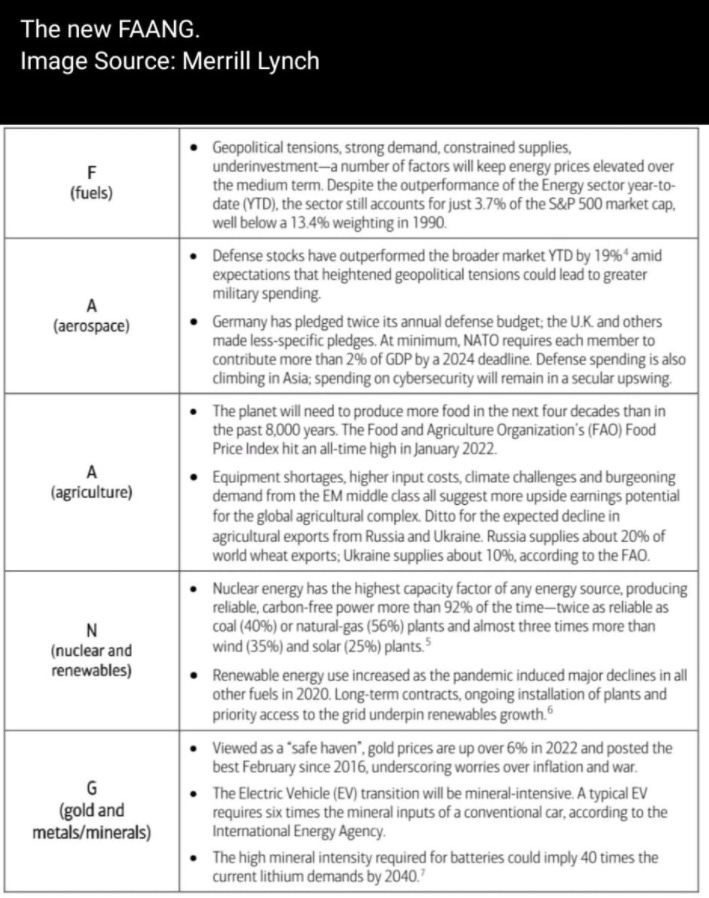
Paid subscribers know that I’ve been carrying these names in my portfolio, but I’d like high highlight the “aerospace” assets. Though the situation might not escalate to a direct conflict, countries — such as Germany — should increase their budget to Defense.

Also, lower growth, higher inflation, and geopolitical conflicts only benefit a few asset classes, but it huts sales and earnings growth for most. Consequently, I reviewed my estimate for the S&P 500.
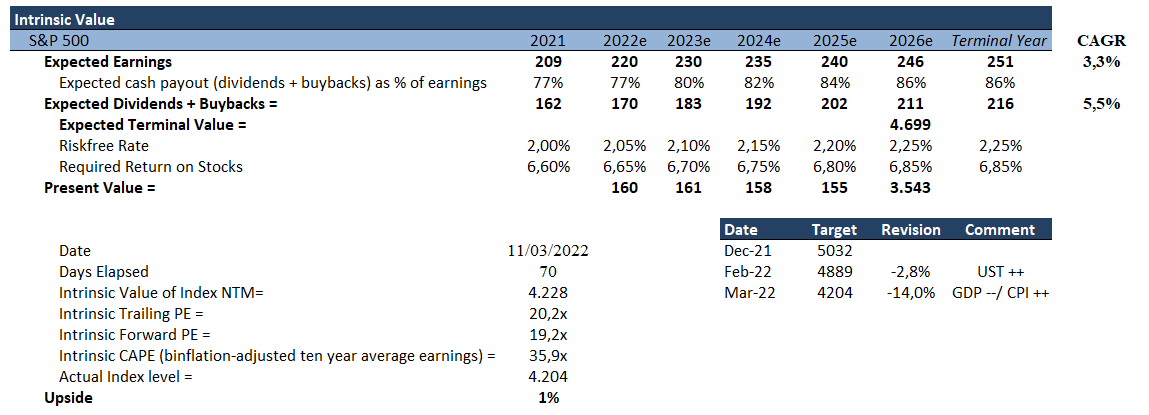
Estimated earnings growth is 3-10% lower than consensus, maintaining other metrics unchanged (for now). Consequently, the new target for 22YE for the S&P500 is 4.200, in line with market prices.
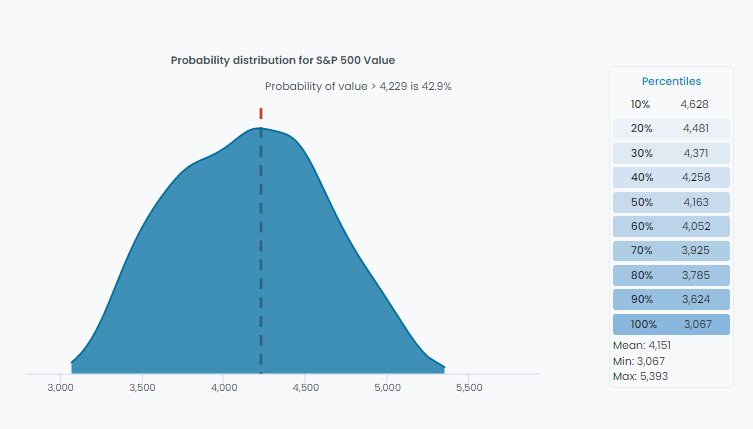
Remember, the output means little. But, nevertheless, the valuable information is that value is going down with prices. Be smart. Go easy on risk.
Ah… Access the interactive model if you’d like to have fun estimating and keeping your own targets for yourself. Have fun.
What charts are telling us?
I posted on Food for Thought #6 that Tech was near a support area, and we should await confirmation for taking the next step.
Well, we had several new breakout attempts throughout the week in the Tech space. I believe the most representative is ARKK.
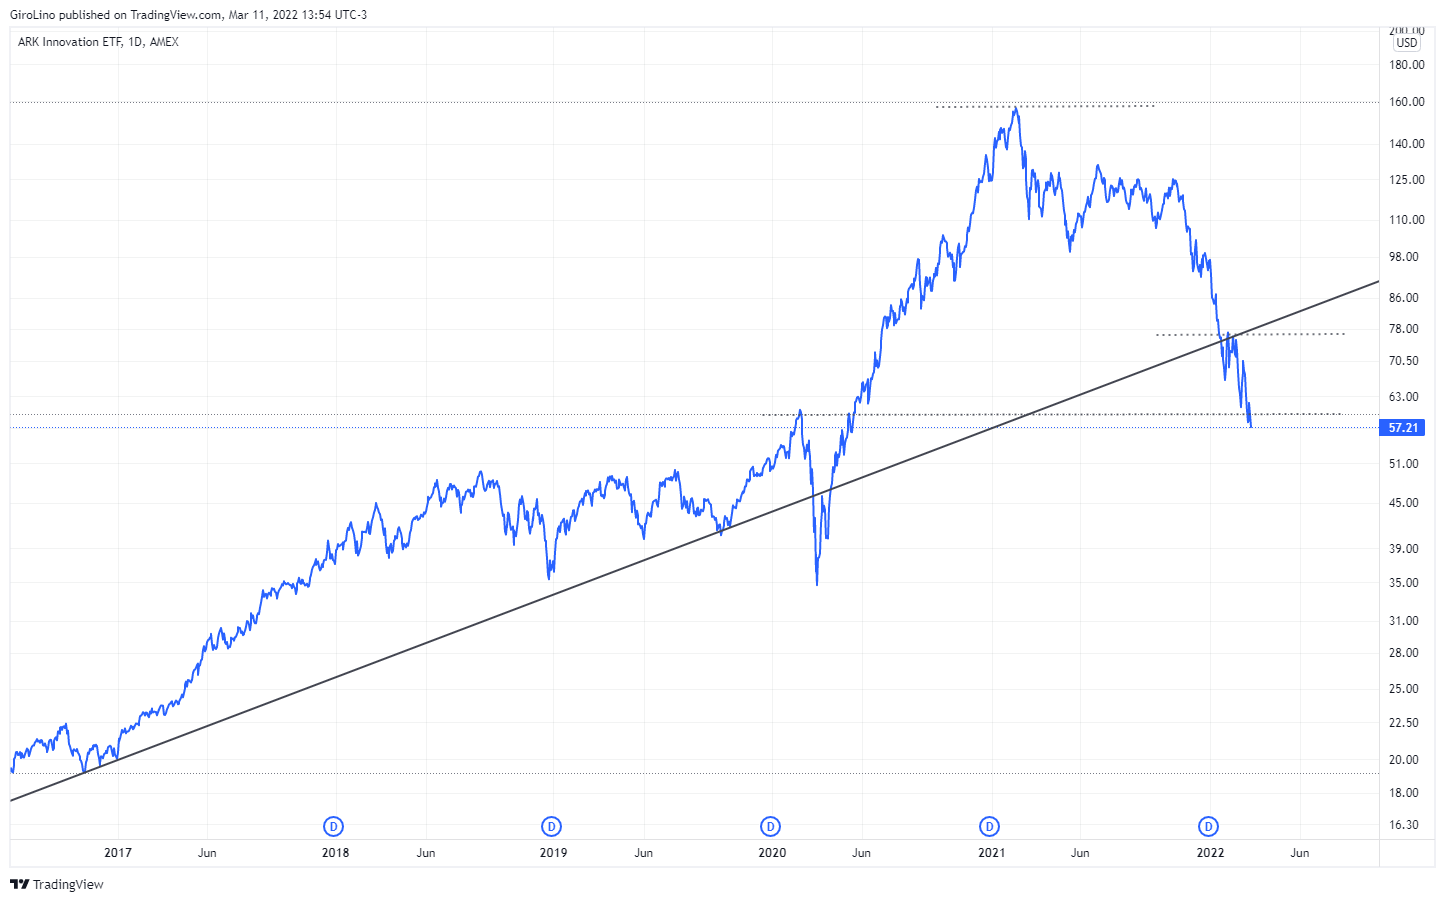
For me, ARK Innovation is much more a liquidity indicator than a proxy for Tech. Nevertheless, different Tech companies’ ETFs are telling us the same message.
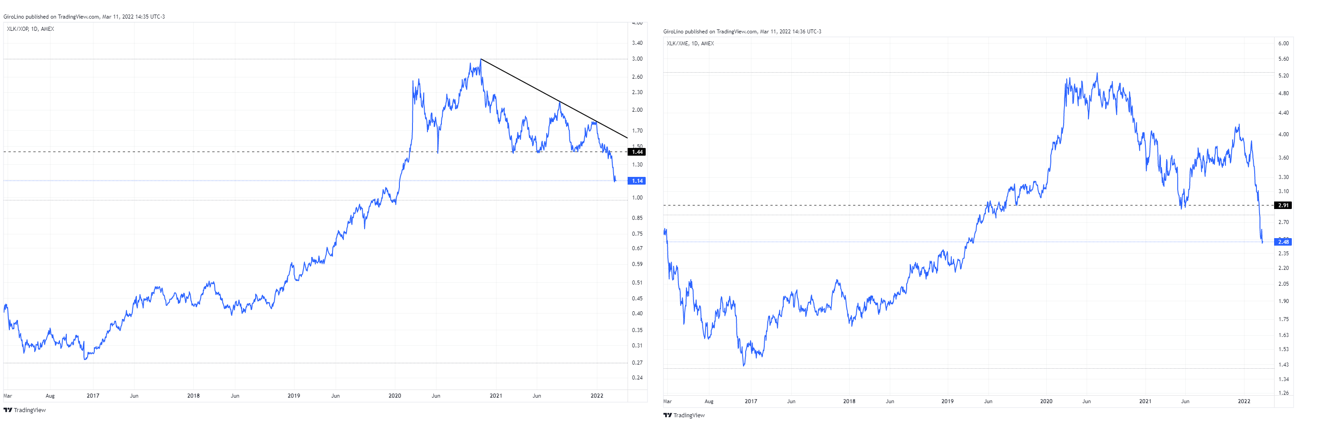
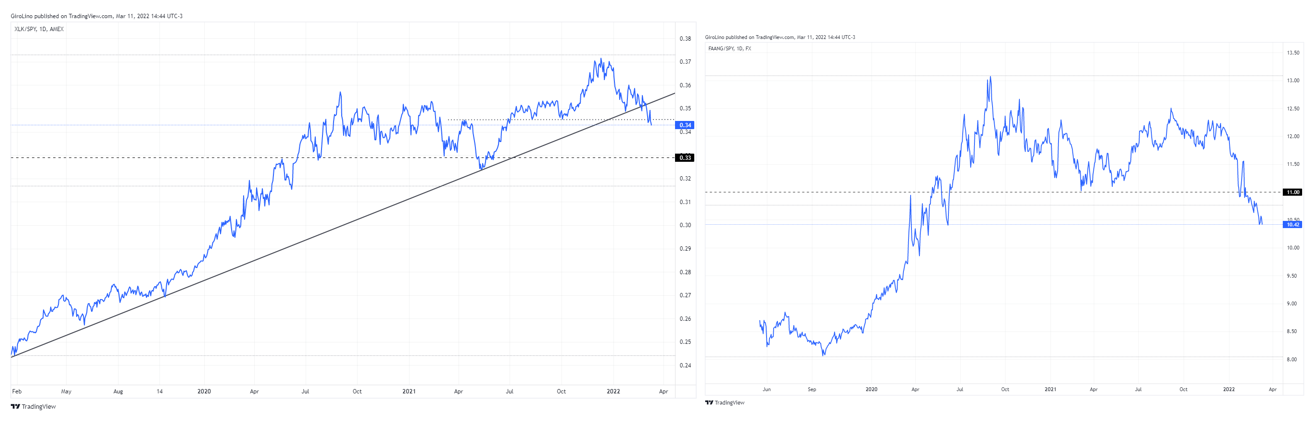
Also, taking a step back and looking from a cycle perspective, the most meaningful breakouts this week were Tech stocks relative to Oil E&P companies and Metals & Mining companies.
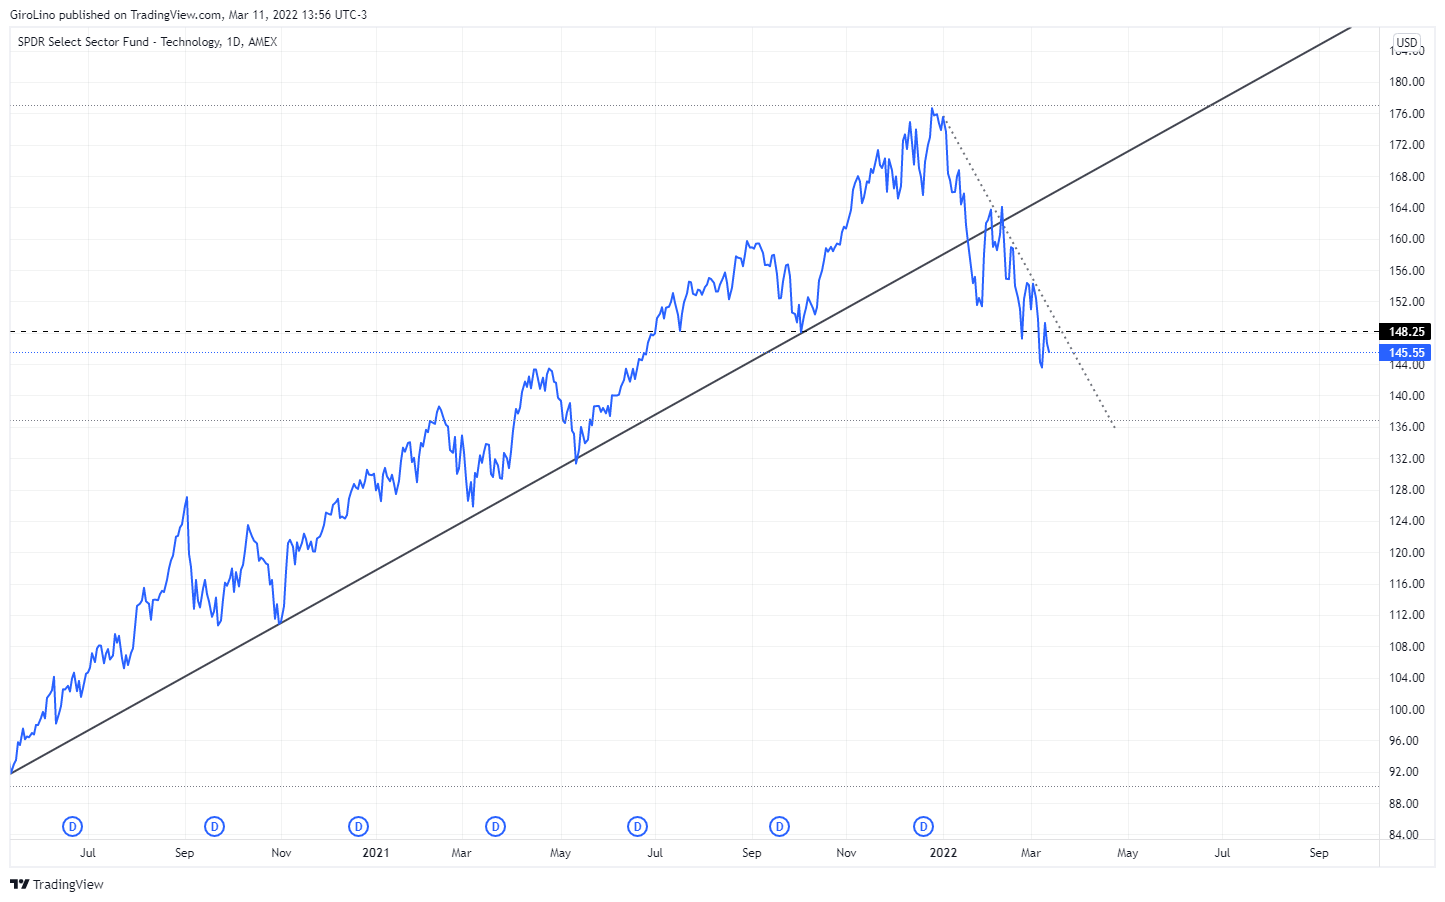
Although big techs represent an important weight in the S&P 500 (~25%), we’ve also seen a meaningful breakout versus the index.
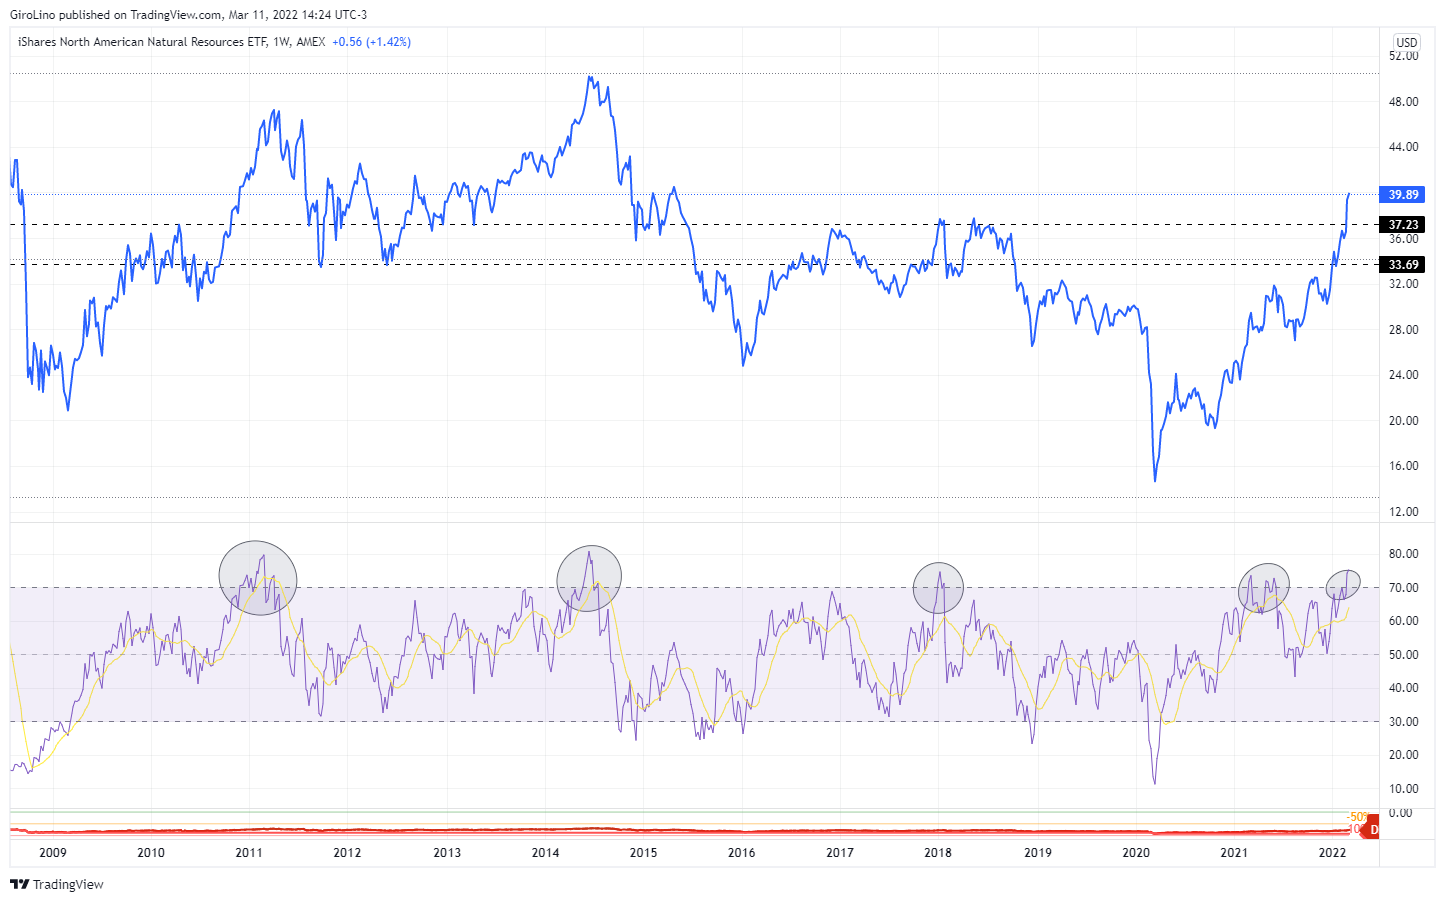
Finally, If we’re going through a bull market for commodities and this period will be different from 2014 to 2020, any retrace should be interpreted as an opportunity to add on weakness.
From Twitter ($MELI, $PBR, Oil, Stagflation)
$MELI

$PBR
Oil

Stagflation

Closed Ideas in 2022
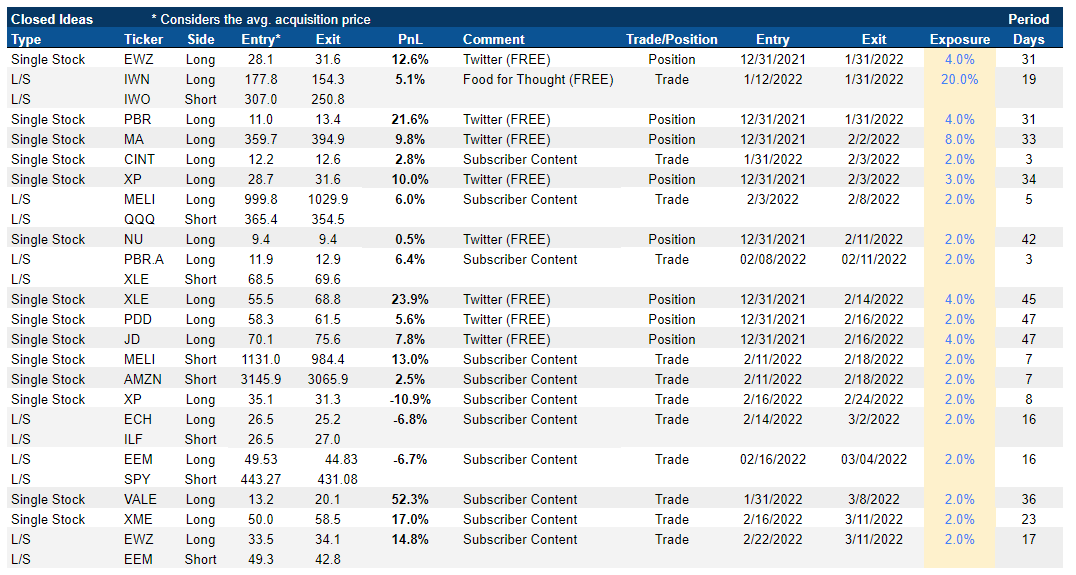
If you’re paid subscriber, don’t worry. I created a new section (“Trade Ideas”) to improve our communication. You can expect to receive all PRO content in your mailbox.
Also, all posts/ideas will be saved in this new section, so you can find any topic much more quickly from now on. : )