Stone's Biggest Moat
Stone's Biggest Moat
Competitive landscape is changing (again)


Hi.
Today’s post is an experiment. I mentioned it on Twitter, but I’m aware that even experienced analysts have difficulties reading the posts due to the amount of information.
Usually, the “Deep Dives” had 20-30 pages with a massive amount of data, a lot of text, and little visual resources.
I recognize this is a personal characteristic, though a not productive for my readers. So, I decided to implement two changes:
More visual resources in the post, trying to substitute at least a chunk of the writing;
I’ll make available a presentation for each Deep Dive from now on. Yeap, a PDF presentation with bullet points, beautiful charts, and everything everybody loves.
I believe this will pose a significant change to content engagement. I don’t want to have you reading my stuff one time and forgetting it forever.
This isn’t about money, churn, or whatever, but building the best product. But, of course, the best has to be handy. So, for instance, we have over 100 pages published about STNE 0.00%↑ and MELI 0.00%↑ .
Except for me, who else read the +200 pages a couple of times, took notes, and reviewed the data? Nobody did, of course.
So, I have to simplify without losing the rigorous analysis process I stand for. This is why the presentation is an incremental feature. I’m not publishing less or charging more money for that.
Anyway, as always, reach out if anything displeases you. I’m always glad to improve whatever and to adjust for better user usage.

A lot has happened in the payment industry since we wrote our first post on Stone in November 2021.
Long-term rates in Brazil went up 200bps with higher public spending, commodities pressuring inflation and the mistakes made by the Brazilian Central Bank (“BCB”).
In February, we wrote an update about funding costs pressuring Stone's earnings in 2022, higher competition leading to higher sales and marketing expenses, and supply chain disruption affecting the hardware prices.
In short, our outlook for Stone is unchanged. Stone will likely continue to face challenges in posting significant earnings expansion.
First, even though Stone suspended the credit operations, the company lost a lot of financial resources due to credit losses and incremental investment in infrastructure related to tech.
Second, Brazilian Central Bank has been increasing interest rates (+1,075bps in the cycle so far), pressuring Stone’s financial expenses and price pass-through.
Even though Stone announced new price policies in 2022 during its earnings call, as we flagged, it would not be enough to surpass the damage caused by higher rates.
Also flagged, there was an enormous downside risk to Stones earnings in 2022, that was in the R$750mn-R$1,000bn, while we were suggesting ~R$400mn.
As of today, the consensus expects R$500mn for Stone in 2022. We disagree and believe there is a downside risk for these estimates because they were wrong before: they are not estimating the financial expense correctly.
Think about it. Usually, Stone's pre-payment has a 60 tenor. So, throughout one quarter, the company has to lend money from banks/FIDCs to borrow it.
We don’t know if there is a formal name, but we call it intra-quarter debt. Analysts have to estimate the intra-quarter debt to match the financial expense, applying the 60 days tenor to figure out the financial debt.
Does it sound hard? Yeah, this is probably why a minority of them estimate it accordingly.I'm thankful that I don't have to figure out how to estimate the credit portfolio anymore. Unfortunately, when a bank changes its underwriting process, forget everything you believe you knew about it.
Third, Stone has been signalizing to the market higher selling expenses from now on. Low-hanging fruits are over, so incremental merchants’ addition should come at higher costs.
For the first time, we found clear evidence that finally proves the payment industry's competitive landscape is getting harder. Of course, it will sound foolish when we illustrate it, though we’ve seen nobody else figuring this out.
We’re excited to share this new piece of evidence today.
The Outline
Biggest Competitive Advantage
Payment Industry Model
Model Update
Interactive Model as Well 👌
Biggest Competitive Advantage
In the past years, we’ve heard that the most significant competitive advantage Stone had was its tech, though it always sounded like an empty speech.
Let me tell you a little truth here... If someone tells you that "its proprietary tech" is the company's most significant competitive advantage, probably the person knows nothing about the company/industry.In our opinion, tech is important, indeed. It enables the company to expand over a smaller structure, minimizing the growth friction and improving sunk costs over time.
However, we see tech as an enabler, not a competitive advantage. For instance, if you give us US$10-US$20mn, we could hire a team and build an architecture very competitive.
Following this, the next question would be: after developing the tech, would you be able to compete against Stone? Well, nope.
And don't even mention Linx. The most oversaturated SaaS solution sector in the world.So, probably there is something else there. But, in our opinion, Stone’s most significant competitive advantage relies on distribution due to its hub strategy.
By far, the hub is the most extensive business that Stone has. According to our channel check, +90% of the sales force focuses on the hub strategy. So, let’s uncrack the strategy.
Stone’s strategy is looking for cities with +500k inhabitants in Brazil as a possible spot for a hub. Usually, they place ten sales representatives, three logistic employees and one leader for 100sqm rented spaces.
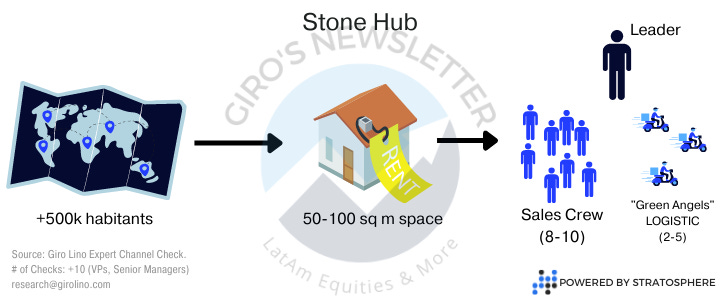
The secret sauce is consistency. People get early in the hub, have a meeting with the leader, prioritize spots and review goals, then visit customers and potential new ones.
The sales team's goal evolves to increase the number of clients, lower the churn, solve daily routine problems, such as malfunctioning POS machines, and, mainly, sell pre-payment to customers.
At the end of the day, if the coverage area is meaningful, they regroup once more to share an overall perspective on the market and the clients, so the leader reports to his supervisor on the following day.
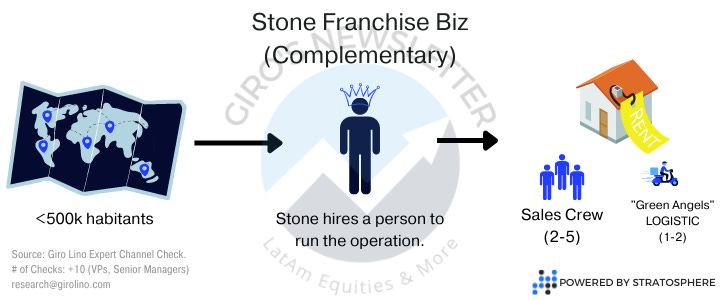
Also, Stone has a complimentary sales force under a franchising model. Unlike the hubs, the franchises focus on cities with <500k inhabitants, where building infrastructure doesn’t make sense.
In this case, the headcount is roughly a third of the hub, and they run an internal process for selecting the franchise owner, who will be the only person proactively contacting Stone.
For curiosity, the process is like any other franchise licensing. Stone, therefore, outsources most of its labor liabilities to smaller locations, and the person in charge has skin the game for economic decisions, which makes sense.
Finally, then you have the supervisor. It is the person responsible for hiring the franchise leader and managing ~15 of them. In addition, the supervisor has to contact franchise owners daily or visit them among its duties.
He is responsible for training, setting goals, and checking if there is any gap in the routine for that specific region.

Also, Stone offers to franchisees most of the back-office needed for the operation (HR, Accountancy), reducing the back-office costs for the business owner.
There is a substantial competitive differential having franchises in smaller locations. First, incumbents, such as ITUB 0.00%↑ (Rede), and Cielo, will never (ever) sell franchise licensing.
Second, franchises allow Stone to offer a last-mile solution in smaller regions. For instance, imagine you own a restaurant and operate under Cielo. It’s 12:30PM, the restaurant is full, and your POS dies.
Then, after 30min waiting for someone at customer service to pick up your call, you’ll receive the “great” news that your new machine will arrive tomorrow morning.
This is powerful!!!Stone’s core business is distribution. Selling POS machines is a high-touch process. You can’t expect to deliver the product and believe that your company did a good job.
In a smaller city, the only company visiting you weekly will be Stone. So it’s hard to imagine you’ll not pick them up as your primary or secondary POS machine.
Outdated, incumbents rely on their relationship with merchants using bargain power and obligating them to keep using the POS machine to assure discounts in credit lines and/or checking account services.
This is a ridiculous value proposition. If you are a business owner, you’ll probably use the incumbent POS until you reach the minimum expenditure and switch to Stone because you rely on them.
Stone’s support is quite remarkable. As I bought a POS machine to try the features, I called support twice between 2AM-4AM, and someone picked the phone up in about 10 seconds.
I didn't ask for a POS replacement, though the support team told me I could have it in 10 minutes. I don't know if I have a hub nearby, but 10 minutes sounded astonishingly quick. Payment Industry Model
If you have been following us for a while, you probably know that we have a favorable view of neobanks for the financial system, especially about product penetration.
To give a context, in recent years, technological developments in the financial and banking sectors have allowed more and more people to access their bank accounts and finalize banking operations from their devices and apps.
Neobanks, are app-based financial services providers with no physical location for their customers. Instead, their banking services are conducted entirely online via desktop or mobile app.
Thanks to lower costs for running their operations, these new players in the banking industry can focus on customer experience, ease of use, and more personalized services, while offering lower fees compared to traditional banks and even free basic accounts.
We hypothesize that neobanks will be part of something much bigger than themselves, accelerating card adoption due to the first mobile solution advances. We talked a lot about it in our introductory post on Nubank.
Also, if you haven’t read our posts about Pix, we suggest reading at least Part III, where we explain our thesis for the financial impact on the companies. It’s essential to fully understand this post.
While writing the post about Nubank, we had the idea of relating financial product penetration with digital inclusion/adoption. So we cross-checked data, and it actually worked.
So, we built a simple, though it’s robust, a top-down model for card spending for estimating the TAM for acquirers.
Even though it sounds complicated, it’s straightforward. We considered the Personal Consumption Expense (“PCE”) for estimating the card (credit+debit) expense.
So, in the following illustrations, we pretend to invalidate the myth that Brazil has been a high-growth country and the blablabla around it.
First, if you consider the real consumption growth, the value is extraordinarily volatile due to higher inflation in the region.
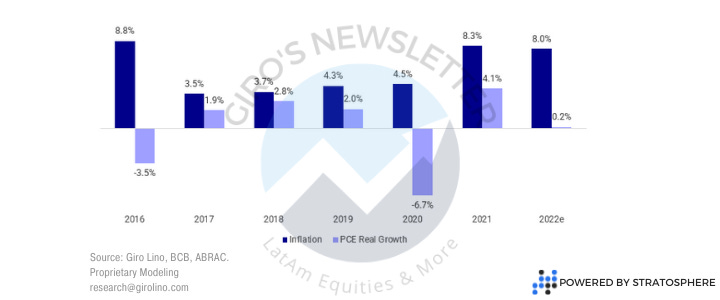
For instance, from 2015 to 2021, the PCE grew a shy 0.1%. Again, inflation consumed all the value generated. Second, since 2016, economic performance has never contributed more than product substitution for card spending growth.

We had a prolonged discussion about it in our last post about MercadoLibre’s marketplace operation. As a matter of fact, since 2008, economic conditions have never contributed to more than 50% for eCommerce operators.

Finally, in the following illustration, we show our estimates for card penetration in Brazil as a percentage of PCE. Again, we expect that credit card momentum will keep playing out since we do not believe Pix will take its place.
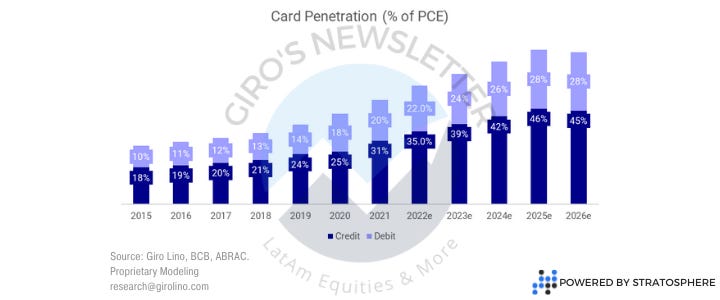
However, based on historical growth, we observed that Debit and Prepaid Card growth decelerated since Pix was launched, raising whether Pix isn’t stealing the incremental volume directed to Debit.
If that is the case, and the argument sounds reasonable,Debit card penetration should slow in the following years, which we considered in our modeling.

Before jumping into the market share estimates, we ran the last test to estimate the credit card profit pool breakdown between MDRs, network fees, and interchange fees.
Interestingly, the result showed that network companies, such as MA 0.00%↑ and V 0.00%↑ , are losing share in the profit pool. Probably, this happened because both companies didn’t pass through during the crisis.

Jumping to the company level, we extended our model for estimating the market share for the dominant players in the acquiring market share. Probably, this is the same image you could ask for any sell-side analyst.
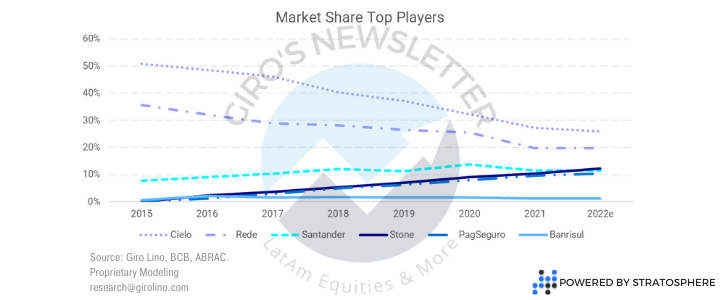
However, there is a massive mistake in the image above we didn’t notice before. If you take a deep dive into the market share breakdown and start matching winners and losers, the sum is different from zero.
That means that the so-called dominant players have been losing share to a new outsider(!). The easiest way we could figure to demonstrate this is by summing the market share of the dominant players.
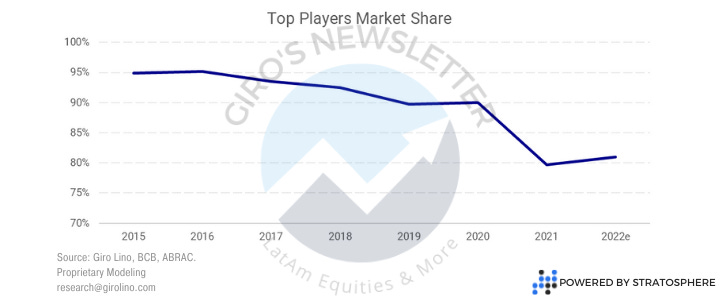
Cool chart. If someone ever asks you the importance of double-checking, show this chart :)The image above shows that the top players are losing share to new entrants growing faster, even though companies such as Stone have been presenting a very attractive compounded annual growth rate.
After a couple of days, we realized the problem is that analysts are so industry-biased. We just can’t consider an outsider from a different primary sector.
I included this one.The answer is obvious: MercadoLibre. Our little beast. Hold your chair, dude. Since 2017, Meli has taken +10% of the market share in the payment industry. 😲
We didn’t realize that because Pago’s CAC is so small, we didn’t relate it to TPV growth. It’s remarkably astonishing how much Meli grew in the past five years and how cheap they paid for so much growth.

And there is our new bear case for the whole industry. We’re not going through Pago’s growth engine today, but how cheap they paid for this growth is breathtaking.
We simply do not feel comfortable anymore with our growth rates for Stone after figuring out they could face Meli directly.
Even though Pago is a sub acquired, we believe there is a tremendous value in the payment gateway solution they offer to clients (see Shopify).
Model Update
Our approach to growth is a little different from the traditional. We estimate the capital the company needs for maintaining its operation and use the excess cash for growth. That is it.
It’s much more complex because it takes time to figure out how the different engines work together, but modeling becomes more robust.
So, what we changed that affected our growth for Stone was the CAC. We kept an elevated CAC for a longer time, impacting our long-term growth expectations.

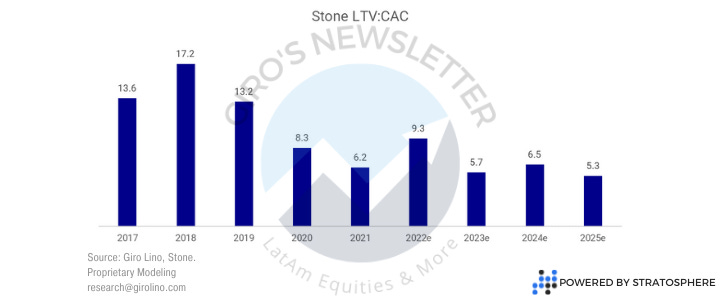
There is another way to demonstrate the impact we’re estimating. Instead of looking at growth and margin composition, we estimated Stone’s LTV:CAC, a standard indicator these days.
We’re considering a base case where the LTV:CAC should keep a similar level since Meli started to expand aggressively. But, we cannot estimate further impacts in the industry dynamics due to the lack of evidence.
Nevertheless, in terms of product complementarity, players such as Rede, Getnet, and PagSeguro are a much more probable market share target.
Again, we’re not referring to marketing strategy but thinking about how each product could complement the other. We’ll go through each service provider in our deep dive into the POS Machine experiment we’ve made.
However, the Meli gang defeated us in our pool to decide the next deep-dive post. It was a fair game, though. More writing about Meli being produced. 🤟🤟🤟
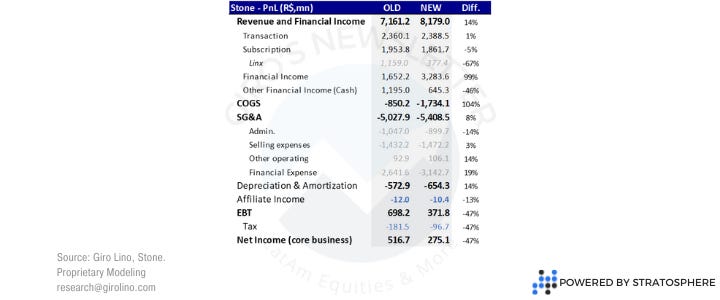
The classic “Old vs. New” estimate illustration. There is no big news on this one, though. It’s pretty much everything we’ve talked about so far. You can have more granularity in the interactive model if you wish.